Search
(+)
cartoon
dealer
buy stock illustrations
Home
My rookie portfolio
📷 Upload yours 🤳
Find results that contain
all
of your keywords. Content filter is
on
. Search will return
best illustrations, stock vectors and clipart
.
Exclude
Make it so!
You have chosen to exclude "
" from your results.
Choose orientation:
Related commercial searches:
stock
trade
chart
trading
graph
seamless
pattern
repeating
black
candle
forex
market
isolated
white
background
repeated
vector
illustration
binary
options
green
red
set
transparent
solid
upside
reversal
stick
shape
downside
Page
of 6
←
→
Order by:
relevancy of keywords
|
publishing date
|
most downloaded
Doji
Cartoons, Illustrations & Vector Stock Images
- 153 images
Stock trade chart. Trading graph seamless pattern. Repeating black candle forex market isolated on white background. Repeated
Vector illustration. binary options. Green and red candle. Trade
Set of transparent and solid upside reversal candle stick pattern
Set of red and green candle stick shape
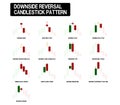
Set of transparent and solid downside reversal candle stick pattern
Set of red and green upside reversal candle stick pattern
Stock trade chart. Trading graph. Black candle forex market isolated on white background. Candlestick investment finance
Set of transparent and solid candle stick shape
Set of red and green downside reversal candle stick pattern
Stock trade chart. Trading graph seamless pattern. Repeating black candle forex market isolated on white background. Repeated
Analyzing Market Trends from Above A Comprehensive Look at Candlestick Patterns and Trading Activity in Financial
Global Financial Market Volatility Detailed Candlestick Chart Analysis of Worldwide Trading Activity
trend candle stick chart
Understanding Stock Market Trends with Candlestick Charts A Comprehensive Guide to Financial Analysis
bullish candle stick chart
Analyzing Market Trends A Comprehensive Vector Graphic of Financial Market Candlestick Charts for Trading Strategy
Detailed Candlestick Chart Analysis A Comprehensive Guide to Technical Trading Insights from a HighQuality Chart Image
Understanding Market Trends A Comprehensive Guide to Candlestick Chart Patterns for Bullish Bearish and Neutral Market
Elliot bullish stock bar chart
Bullish Candlestick Chart on Blue Digital Background Resembling Monochrome Graph Against Sky.
Elliot Bearish stock bar chart
Next Page
←
↑
↓
→
See more images