Search
(+)
cartoon
dealer
buy stock illustrations
Home
My rookie portfolio
📷 Upload yours 🤳
Find results that contain
all
of your keywords. Content filter is
on
. Search will return
best illustrations, stock vectors and clipart
.
Exclude
Make it so!
You have chosen to exclude "
" from your results.
Choose orientation:
Explore cartoons & images using related keywords:
abstract
art
background
black
blue
chart
circle
cmyk
collection
color
colorful
colors
colour
concept
creative
creativity
cyan
decoration
design
diagram
difference
element
explaining
graphic
green
grey
guide
icon
illustration
ink
isolated
light
magenta
modes
paint
palette
paper
pattern
pink
press
print
rainbow
red
rgb
shape
sign
spectrum
swatch
symbol
vector
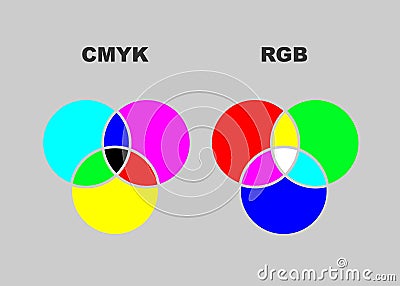
Vector Chart Explaining Difference Between CMYK And RGB Color Modes. Isolated
Download
Designed by
Robatz
Title
Vector chart explaining difference between CMYK and RGB color modes. Isolated #109699378
Description
Vector chart explaining difference between CMYK and RGB color modes. Isolated or grey background
Set of vector infographic circle templates
Vector circle infographic template for graphs, charts, diagrams.
Circle infographic template. Vector layout with 8 options
Vector circle arrows for infographic. Template for cycling diagram, graph, presentation and round chart. Business
Collection of 6 vector circle chart templates 10 options.
Vector circle chart template for infographics 6 options.
Abstract 6 steps modern pie chart infographics elements.Vector illustration.
Creative vector illustration of bmi, body mass index infographic chart with silhouettes and scale isolated on
Line step infographic. 5 options workflow diagram, circle timeline number infograph, process steps chart. Linear vector
Infographic dashboard. Ui interface, information panel with finance graphs, pie chart and comparison diagrams. Vector
Arrow process steps chart. Business startup step arrows, work flow graph and success stages vector infographic concept
Vector circle chart infographic template with arrow for cycle diagram, graph, web design. Business concept with 6 steps
Chart icon. Increase schedule in magnifier. Analysis and statistics data symbol. Vector illustration isolated on white background.
Comparison table. Price chart template, business plan pricing grid, web banner checklist design template. Vector compare