Search
(+)
cartoon
dealer
buy stock illustrations
Home
My rookie portfolio
📷 Upload yours 🤳
Find results that contain
all
of your keywords. Content filter is
on
. Search will return
best illustrations, stock vectors and clipart
.
Exclude
Make it so!
You have chosen to exclude "
" from your results.
Choose orientation:
Explore cartoons & images using related keywords:
background
bar
business
button
chart
circle
collection
color
computer
concept
data
design
diagram
digital
download
element
graph
graphic
icon
illustration
indicator
info
infographic
information
interface
internet
isolated
load
loader
percent
percentage
presentation
process
progress
round
set
shape
sign
site
symbol
technology
template
time
upload
vector
web
website
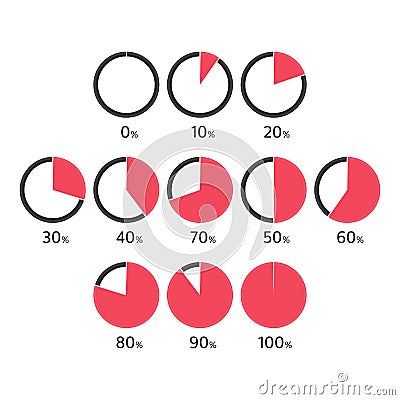
Red Pie Charts. Vector Illustration
Download
Designed by
Artsonik
Title
Red pie charts. #209932202
Description
Circle loading or pie charts isolated on white background. Template graph pie chart with gradations 10 20 30 40 50 60 70 80 90 100. Vector illustration EPS 10.
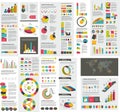
Set of business flat design elements, graphs, charts, flow chart.
Mega Set of infographic percentage circle pie charts
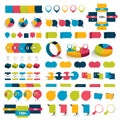
Mega set infographics flat design elements, schemes, charts, buttons, speech bubbles, stickers.
Mega Collection of charts, graphs, flowcharts, diagrams and infographics elements.
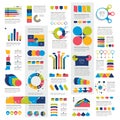
Mega set of infographics elements charts, graphs, circle charts, diagrams.
Mega set of infographics elements charts, graphs.
Big set of infographic elements charts, diagrams, speech bubbles.
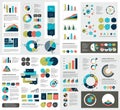
Mega set of infographics elements charts, graphs, circle charts, diagrams, speech bubbles.
Mega set of infographics elements charts, graphs, circle charts, diagrams, speech bubbles. Flat and 3D design.
Mega set of infographics elements charts, graphs, circle charts, diagrams, speech bubbles.
Business graph and charts
Flat infographic elements. Presentation chart element, percent graph banner and infograph flowchart. Charts for
Infographics set. Charts, diagrams and graphs. Flowchart, data bars and timeline for report presentation vector
Dashboard UI. Futuristic data panel with user interface elements, diagrams and charts. Vector data analytic and
Histogram charts. Business infographic template with stock diagrams and statistic bars, line graphs and charts for