Search
(+)
cartoon
dealer
buy stock illustrations
Home
My rookie portfolio
📷 Upload yours 🤳
Find results that contain
all
of your keywords. Content filter is
on
. Search will return
best illustrations, stock vectors and clipart
.
Exclude
Make it so!
You have chosen to exclude "
" from your results.
Choose orientation:
Explore cartoons & images using related keywords:
100
backdrop
background
bar
business
chart
circle
circular
collection
concept
data
design
diagram
download
element
finance
flat
graph
graphic
icon
illustration
indicator
info
infographic
information
isolated
loading
percent
percentage
pie
plan
presentation
process
progress
red
report
round
set
sign
statistic
symbol
technology
template
ten
time
vector
web
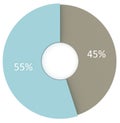
Percentage Infographic Progress Diagrams Circles. Red Percent Pie Charts. Vector Illustration
Download
Designed by
Stas11
Title
Percentage infographic progress diagrams circles. Red percent pie charts. Vector illustration #231617732
Description
Percentage infographic progress diagrams circles. Red percent pie charts. Vector illustration.
Flat Percentage Infographic
45 55 percent pie chart. 3d render percentage infographic symbol. Circle diagram isolated
Set of circle percentage diagrams from 0 to 100 for infographics, lignt, 5 10 15 20 25 30 35 40 45 50 55 60 65 70 75 80
Set of circle percentage diagrams from 0 to 100 for web design, user UI interface or infographic - indicator with blue color.
5 10 15 20 25 30 35 40 45 50 55 60 65 70 75 80 85 90 95 100 percent charts. Vector percentage infographic set. Gradient arrow
Male and female statistic. People percentage infographic design elements.
Percentage infographic design vector 3d circles
Percentage infographic progress diagrams circles. Blue percent pie charts. Vector illustration
Human population demography percentage infographic. Infographics coloured differently depending of percentage vector
Circle with percentage. Infographic for progress of load. Round graph of download. Bar with percentage from 10 to 100. Set for
Percentage infographic progress diagrams circles. Green percent pie charts. Vector illustration
70% percentage infographic set. Seventy circle diagram, pie donut chart, progress bar. 70 percent loading data icon. Vector
57% percentage infographic set. Fifty-seven circle diagram, pie donut chart, progress bar. 57 percent loading data icon. Vector
89% percentage infographic set. Eighty-nine circle diagram, pie donut chart, progress bar. 89 percent loading data icon. Vector