Find results that contain all of your keywords. Content filter is on.
Search will return best illustrations, stock vectors and clipart.
Choose orientation:
Make it so!
You have chosen to exclude "" from your results.
Choose orientation:
Explore cartoons & images using related keywords:
chart
bar
timeline
flow
number
circle
business
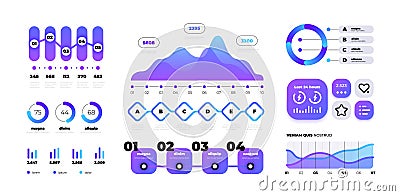
datum finance growth presentation report statistic info marketing progress diagram graph connection economic graphic information organization plan scheme step structure visualization workflow infochart analysis analyzing annual process management option gradient colorful app application performance isolated infographic template vector illustration design element setChart Infographic. Colorful Gradient Bar Diagram And Timeline Flow With Numbers, Circle Graphic Template. Vector
Designed by
Title
Chart infographic. Colorful gradient bar diagram and timeline flow with numbers, circle graphic template. Vector #245077049
Description

