Search
(+)
cartoon
dealer
buy stock illustrations
Home
My rookie portfolio
📷 Upload yours 🤳
Find results that contain
all
of your keywords. Content filter is
on
. Search will return
best illustrations, stock vectors and clipart
.
Exclude
Make it so!
You have chosen to exclude "
" from your results.
Choose orientation:
Explore cartoons & images using related keywords:
analysis
arrow
art
background
business
chart
concept
design
diagram
different
direction
education
figure
geometry
graphic
isolated
level
line
math
metallic
parallel
pattern
price
resistance
school
science
sign
street
strong
support
technical
trend
triangle
two
vector
white
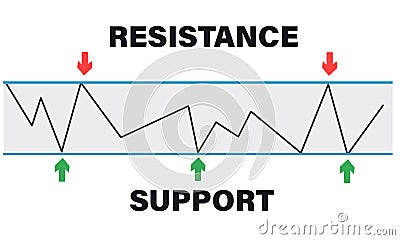
Support And Resistance Level Price Chart Pattern Figure Technical Analysis. Strong Trend Between Two Parallel Level Line Cartoon Vector
Download
Designed by
Veharimohsin
Title
Support and Resistance level price chart pattern figure technical analysis. Strong trend between two parallel level line #252116795
Description
Support and Resistance level price chart pattern figure technical analysis. Strong trend between two parallel level
Bearish trend
trend candle stick chart
Mastering Forex Trading with Candlestick Charts A Comprehensive Guide to Financial Market Investment Strategies
Analyzing Market Trends A Comprehensive Vector Graphic of Financial Market Candlestick Charts for Trading Strategy
Analyzing Cryptocurrency Market Trends A Detailed Look at Candlestick Patterns on a Laptop Trading Platform
3D Gold Chart Analyzing Market Trends for Investment Opportunities in Precious Metals and Stocks
Detailed Candlestick Chart Analysis A Comprehensive Guide to Technical Trading Insights from a HighQuality Chart Image
Visualizing Stock Market Trends Interactive Charts and Graphs Displaying RealTime Financial Data
Mastering Stock Market Chart Patterns A Comprehensive Guide to Technical Analysis and Trading Strategies
Analyzing Forex Market Trends from Above Unveiling Trading Strategies and Chart Patterns for Profitable Financial
Comprehensive fore trading chart analysis candlestick patterns trend lines support, resistance, and market volatility insights