Search
(+)
cartoon
dealer
buy stock illustrations
Home
My rookie portfolio
📷 Upload yours 🤳
Find results that contain
all
of your keywords. Content filter is
on
. Search will return
stock photos and royalty free images
.
Exclude
Make it so!
You have chosen to exclude "
" from your results.
Choose orientation:
Explore cartoons & images using related keywords:
line
font
diagram
circle
text
brand
drawing
logo
presentation
document
cartoon
number
organ
map
sketch
graphs
function
inverse
proportionality
numerical
axis
blue
negative
coefficient
red
positive
coefficien
coeffi
calculate
calculation
chalkboard
chart
concept
construction
creative
definition
design
education
element
equation
formula
geometric
geometry
graph
graphic
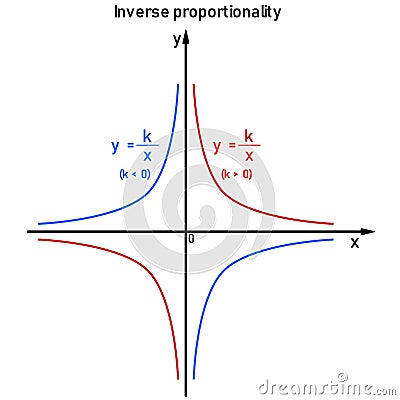
Graphs Of The Function Of Inverse Proportionality On The Numerical Axis Stock Photo
Download
Designed by
Radekjosefus
Title
Graphs of the function of inverse proportionality on the numerical axis #270891012
Description
Graphs of the function of inverse proportionality on the numerical axis, blue for a negative coefficient, red for a positive coefficient
Doodle math blackboard. Mathematical theory formulas and equations, hand drawn school education graphs. Vector geometry
Business data market elements charts diagrams. Graphs flat icons set. Graph curve. Schedule in vector for design and
Business data market elements charts diagrams. Math function graphs. Data charts diagrams
These are logos, symbols, icons, smartphones, data, graphs.
Graphs of the exponential function on the number line
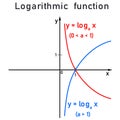
Graphs of a logarithmic function on a number line
Three specific examples of graphs of the sine function on the number axis distinguished by color
Green board with mathematical calculations, equation and function graphs.
math geometry graphs collection set vector illustration. Linear, constant, logarithmic, exponential, square root, logistic
Inverse proportionality function - formula and two graphs
Logarithmic function - formula and two red graphs
Inverse proportionality function - color-coded graphs of two different functions on the coordinate axis
Exponential function - formula and two red graphs on the number line