Search
(+)
cartoon
dealer
buy stock illustrations
Home
My rookie portfolio
📷 Upload yours 🤳
Find results that contain
all
of your keywords. Content filter is
on
. Search will return
best illustrations, stock vectors and clipart
.
Exclude
Make it so!
You have chosen to exclude "
" from your results.
Choose orientation:
Explore cartoons & images using related keywords:
wine
italian
italy
parma
modena
ravenna
bologna
vintage
vector
graphic
map
mediterranean
grape
variety
cultivation
ham
beverage
design
icon
red
region
cartography
contour
chart
detailed
geography
outline
silhouette
vineyard
taste
winery
geographical
restaurant
european
retro
industry
product
production
types
element
characteristic
gastronomy
travel
diagram
graph
scheme
Chart Of Typical Wines From Emilia Romagna, Italy Vector Illustration
Download
Designed by
Doomko
Title
chart of typical wines from Emilia Romagna, Italy #298650750
Description
chart of typical wines from Emilia Romagna, Italy. vector illustration
Corporate Structure Business Org Chart
Recommended dietary food pyramid and ketogenic food pyramid, simplified chart
chart of typical wines from Marche, Italy
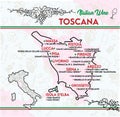
chart of typical wines from Tuscany, Italy.
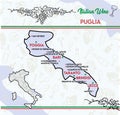
chart of typical wines from Puglia, Italy
This photo captures a detailed close up of a brightly colored bar chart placed on a table, A diagram of typical investment
close-up view stock market graph displays downward trend, with red and orange line indicating decline in
close-up view stock chart displays series blue lines and curves, suggesting fluctuating market trend.
close-up view stock market graph displays sharp upward trend, with red and green lines indicating gains or
colorful pie chart with central red circle and various slices representing different sections, connected by
stock chart with downward trend, featuring red and orange line, is displayed on computer screen with blurred
Modern gradient line chart showing market fluctuations
Digital stock market chart with colored lines, price fluctuations over dark grid