Search
(+)
cartoon
dealer
buy stock illustrations
Home
My rookie portfolio
📷 Upload yours 🤳
Find results that contain
all
of your keywords. Content filter is
on
. Search will return
best illustrations, stock vectors and clipart
.
Exclude
Make it so!
You have chosen to exclude "
" from your results.
Choose orientation:
Explore cartoons & images using related keywords:
axis
blue
calculate
calculation
chalkboard
chart
colored
concept
construction
creative
definition
demonstration
design
diagram
drawing
education
equation
formula
function
geometric
geometry
graph
graphic
information
knowledge
learn
logarithmic
math
mathematics
maths
object
presentation
red
school
board
science
shape
solution
study
teach
teacher
template
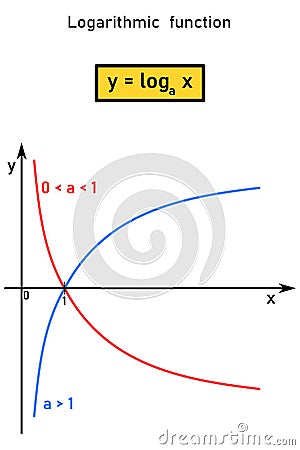
Graphical Representation Of A Logarithmic Function And Its Equation Stock Image
Download
Designed by
Radekjosefus
Title
Graphical representation of a logarithmic function and its equation #318240151
Description
Graphical representation of a logarithmic function on a number line and its equation
Abstract design background. A graphical representation of a perspective
Technology / science: Multi color liquid in test tubes in a rack. Graphical representation for a bar chart, statistics or data. 6
Surveyor equipment. Surveyor telescope at construction site or Surveying for making contour plans is a graphical representation of
Graphical representation about progress of windmill energy project
Step by step process. Number step 1, 2, 3 graphical representation of the process. Business concept for new beginnings
Engineer Reviewing Detailed Cost-Benefit Analysis Report for Construction Project with Graphical Cost-Benefit Representation
Graphical representation of a chess battle. AI generated.
A graphical representation on a computer screen showing complex algorithms in action with data anomalies detected and
This is a symmetrical, abstract or minimalist design graphical representation with varying shades of brown - AI
Plumping Action A graphical representation of skin cells expanding as they absorb exosomes showing the plumping effect
Conceptual image showcasing a graphical representation of fluctuating financial market data, evoking the dynamic and
Code Suggestions A graphical representation of code bubbles floating above a programmers head with an AI figure next to
Effectiveness Statistics A graphical representation showing a percentage increase in skin hydration or elasticity after
Block Creation A graphical representation of a block being added to a blockchain with digital miners represented as
Step-by-step action plan as order of priorities in any activity. Number step 1, 2, 3 graphical representation of process