Search
(+)
cartoon
dealer
buy stock illustrations
Home
My rookie portfolio
📷 Upload yours 🤳
Find results that contain
all
of your keywords. Content filter is
on
. Search will return
best illustrations, stock vectors and clipart
.
Exclude
Make it so!
You have chosen to exclude "
" from your results.
Choose orientation:
Explore cartoons & images using related keywords:
abstract
background
price
volume
scatter
plot
chart
trading
financial
market
analysis
computer
screen
display
time
series
data
graph
candlestick
trend
investment
buy
sell
indicator
technical
finance
economy
business
digital
monitor
technology
investor
trader
signal
analytics
cryptocurrency
bitcoin
ethereum
exchange
strategy
forex
volatility
risk
profit
loss
return
yield
portfolio
Stock Price And Trading Volume Scatter Plot Displayed On Computer Screen
Download
Designed by
Semeniuk
Title
Stock Price And Trading Volume Scatter Plot Displayed On Computer Screen #325235400
Description
A computer screen shows a scatter plot of stock prices and trading volume over time. X-axis is time, y-axis is price and volume
Stock Price
Stock price and chart movement
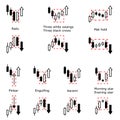
Forex stock trade pattern. Trading signal. Candlestick patters.
Market Capitalization Company Value Stock Price Ticker
Stock price chart
Candlestick stock price graph vector, financial analysing tool
Candlestick downtrend stock price graph vector, financial analysing tool
Stock price plummets with negative news
Financial analysis flat logo, stock price chart, graph icon. Data visualization vector illustration. Sign for business
Trader analyzes stock price changes on the stock exchange.
Currency growth icon set, capital increase, stock price growth, savings accumulation, dollar rate increase ââ¬â vector
Stock price market financial economy business impacted by corona virus covid-19 spread epidemic pandemic outbreak in
Stock price rising concept with candle stick graph with arrow up
Inverted hammer candle stick stock price trading technical analysis