Search
(+)
cartoon
dealer
buy stock illustrations
Home
My rookie portfolio
📷 Upload yours 🤳
Find results that contain
all
of your keywords. Content filter is
on
. Search will return
best illustrations, stock vectors and clipart
.
Exclude
Make it so!
You have chosen to exclude "
" from your results.
Choose orientation:
Explore cartoons & images using related keywords:
business
strategy
data
visualization
graphs
charts
office
growth
analysis
productivity
digital
tools
marketing
financial
indicators
statistics
teamwork
creative
workspace
analytics
performance
technology
corporate
planning
investments
success
innovation
development
project
management
brainstorming
insights
objectives
visual
representation
organizational
goal
setting
strategic
communication
professional
team
collaboration
integration
decision
making
market
trends
solutions
future
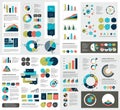
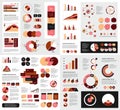
Charts And Graphs Illustrate Business Strategies With Digital Tools And Growth Indicators In A Vibrant Office Setting Cartoon Vector
Download
Designed by
Marzan7373
Title
Charts and graphs illustrate business strategies with digital tools and growth indicators in a vibrant office setting #330100953
Description
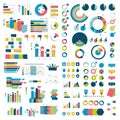
Charts and graphs illustrate business strategies with digital tools and growth indicators in a vibrant office setting.
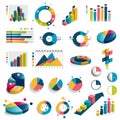
Flat charts, graphs.
Set of business marketing dot bar pie charts diagrams and graphs
Mega Collection of charts, graphs, flowcharts, diagrams and infographics elements.
Mega set of charts, graphs, circle charts.
Mega set of infographics elements charts, graphs.
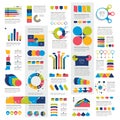
Mega set of infographics elements charts, graphs, circle charts, diagrams, speech bubbles.
Mega set of infographics elements charts, graphs, circle charts, diagrams, speech bubbles. Flat and 3D design.
Mega set of infographics elements charts, graphs, circle charts, diagrams, speech bubbles.
Graphs and charts set. Statistic and data
Dashboard infographic template with modern design weekly and annual statistics graphs. Pie charts, workflow,, UI. EPS 10
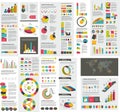
Business data market elements, charts, graphs, diagrams with world map.
Infographics chart set. Charts result graphs icons statistics financial data diagrams. Isolated analysis vector elements