Search
(+)
cartoon
dealer
buy stock illustrations
Home
My rookie portfolio
📷 Upload yours 🤳
Find results that contain
all
of your keywords. Content filter is
on
. Search will return
best illustrations, stock vectors and clipart
.
Exclude
Make it so!
You have chosen to exclude "
" from your results.
Choose orientation:
Explore cartoons & images using related keywords:
chart
graphic
financial
data
visualization
time
series
analysis
market
trends
equity
performance
line
graph
bar
candlestick
moving
averages
support
resistance
levels
volume
indicator
ohlc
openhighlowclose
macd
average
convergence
divergence
rsi
relative
strength
index
williams
bollinger
bands
fibonacci
retracement
ichimoku
cloud
renko
charts
heikin
ashi
pivot
points
trendlines
gann
lines
triangles
Stock Chart Graphic For Visualizing Financial Trends
Download
Designed by
Danielscofano
Title
Stock chart graphic for visualizing financial trends #340672949
Description
Concept Of Stock chart graphic for visualizing financial trends
Stock chart
Stock chart
Stock chart down arrow line light flare
Binoculars with stock chart
Stock chart up
Stock chart down
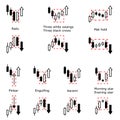
Forex stock trade pattern. Trading signal. Candlestick patters.
Vector uptrend market of stock chart.
Abstract financial chart with line graph and numbers in stock market on gradient white color background
Stock market or forex trading graph chart suitable for financial investment concept. Economy trends background for
Stock crisis red market price arrow down chart fall / Stock exchange market analysis or forex charts graph
3D Chart icon arrow point up, green bar.
Digital stock market or forex trading graph and candlestick chart suitable for financial investment. Financial Investment trends
Compilation of Continuationup trend in one stock chart. There are stock chart with pattern marking and no marking