Find results that contain all of your keywords. Content filter is on.
Search will return best illustrations, stock vectors and clipart.
Choose orientation:
Make it so!
You have chosen to exclude "" from your results.
Choose orientation:
Explore cartoons & images using related keywords:
chart
infographic
analysis
business
performance
evaluation
kpi
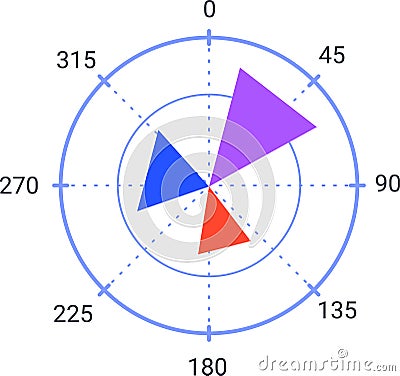
colorful triangles information statistics metrics reporting dashboard progress measurement assessment strategy planning management marketing sales finance research analytics diagram illustration vector design graphic report presentation communication trend growth success target goal achievement improvement insightColorful Radar Chart With Three Triangular Areas Representing Data Analysis, Business Performance Evaluation, And Key Cartoon Vector
Designed by
Title
Colorful radar chart with three triangular areas representing data analysis, business performance evaluation, and key #348450629
Description


