Find results that contain all of your keywords. Content filter is on.
Search will return best illustrations, stock vectors and clipart.
Choose orientation:
Make it so!
You have chosen to exclude "" from your results.
Choose orientation:
Explore cartoons & images using related keywords:
world
visually
visualizations
values
text
statistics
shades
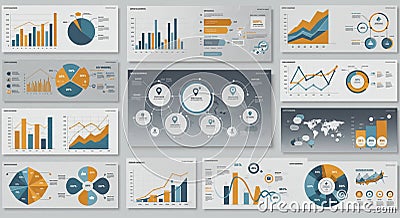
series screenshot regional presentation poster pie percentages organizing orange multimedia modern maps machine line learning information infographic indicating highlight gray graphs geographical gadget formats font featured emphasize elements electronics effectively drawing document display diagram design data complex comparisons clean circular charts cartoon brandA Series Of Infographic Charts And Graphs Display Data Using Various Visualizations. Stock Photo
Designed by
Title
A series of infographic charts and graphs display data using various visualizations. #358739592
Description

