Find results that contain all of your keywords. Content filter is on.
Search will return best illustrations, stock vectors and clipart.
Choose orientation:
Make it so!
You have chosen to exclude "" from your results.
Choose orientation:
Explore cartoons & images using related keywords:
white
visually
used
trends
timelines
text
technology
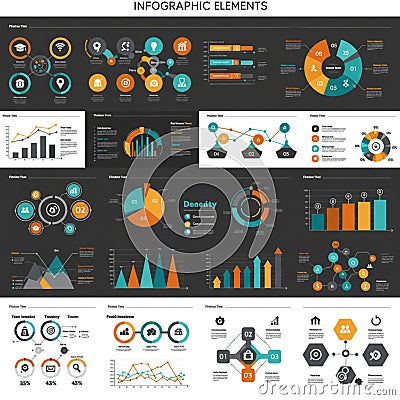
teal structures shapes screenshot represent relationships quickly providing progression presentation pie orange number multimedia logo line information infographic include illustrating icons hierarchical gray graphs games gadget font flow finance features engaging elements electronics education dominant document diagrams diagram design depict data dark conveyInfographic Composed Of Various Elements Such As Pie Charts, Bar Graphs, Line Graphs Stock Photography
Designed by
Title
Infographic composed of various elements such as pie charts, bar graphs, line graphs #358899458
Description


