Find results that contain all of your keywords. Content filter is on.
Search will return best illustrations, stock vectors and clipart.
Choose orientation:
Make it so!
You have chosen to exclude "" from your results.
Choose orientation:
Explore cartoons & images using related keywords:
visualization
varied
top
third
text
starts
square
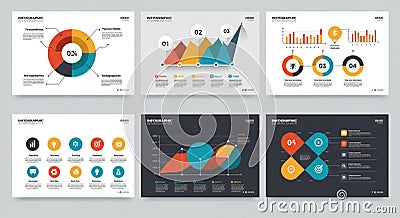
six segments screenshot schemes row red presentation poster plan pie orange numbered next multimedia multilayered multicolored modern markers logo line left learning intersected interconnected infographics infographic icons graph gadget four formats font followed features ends document divided displaying diagram design descriptions data colorfulA Collection Of Six Infographics, Each Displaying Different Data Visualization Formats. Royalty-Free Stock Photography
Designed by
Title
A collection of six infographics, each displaying different data visualization formats. #358963193
Description

