Find results that contain all of your keywords. Content filter is on.
Search will return best illustrations, stock vectors and clipart.
Choose orientation:
Make it so!
You have chosen to exclude "" from your results.
Choose orientation:
Explore cartoons & images using related keywords:
yellow
vertical
values
upward
trends
trend
time
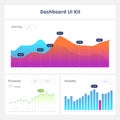
text teal suggests sketch shows shades sets segments screenshot represents red ranging presentation positive plan phrases periods overlapping orange one numerical multiple multimedia month markers map logo line like labels labeled intervals indicating inconsistently horizontal graph gradual font featuring drawing document display diagramLine And Bar Graph Featuring Multiple Data Sets. The Vertical Axis Represents Numerical Stock Photo
Designed by
Title
Line and bar graph featuring multiple data sets. The vertical axis represents numerical #365040684
Description


