Find results that contain all of your keywords. Content filter is on.
Search will return best illustrations, stock vectors and clipart.
Choose orientation:
Make it so!
You have chosen to exclude "" from your results.
Choose orientation:
Explore cartoons & images using related keywords:
visualizations
vertical
top
text
teal
sketch
shows
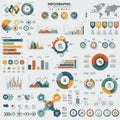
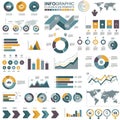
show shades screenshot scheme right presentation predominately plan placeholder pie percentages overlaid multimedia map lorem logo line left labeled ipsum infographic including includes gray graphs graph font featuring features drawing document displays diagram design data combination color circular circle charts chart cartoon brandInfographic Featuring Various Data Visualizations Including Line Graphs, Bar Charts, And Pie Charts. Stock Image
Designed by
Title
Infographic featuring various data visualizations including line graphs, bar charts, and pie charts. #365748325
Description


