Find results that contain all of your keywords. Content filter is on.
Search will return best illustrations, stock vectors and clipart.
Choose orientation:
Make it so!
You have chosen to exclude "" from your results.
Choose orientation:
Explore cartoons & images using related keywords:
scatter
plot
data
visualization
chart
trend
line
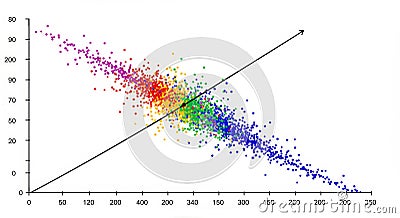
correlation negative points distribution statistical analysis rainbow colors color coded gradient visual representation graph information graphics quantitative qualitative dataset spread clusters outliers regression modeling analytics business intelligence scientific research xaxis yaxis coordinates diagram figure patternData Scatter Plot Visualization A Colorful Scatter Plot Graph Displays Data Points Distributed Along A Negative Correlation Stock Image
Designed by
Title
Data Scatter Plot Visualization A colorful scatter plot graph displays data points distributed along a negative correlation #368375161
Description


