Find results that contain all of your keywords. Content filter is on.
Search will return best illustrations, stock vectors and clipart.
Choose orientation:
Make it so!
You have chosen to exclude "" from your results.
Choose orientation:
Explore cartoons & images using related keywords:
visualizations
values
units
trends
time
text
statistical
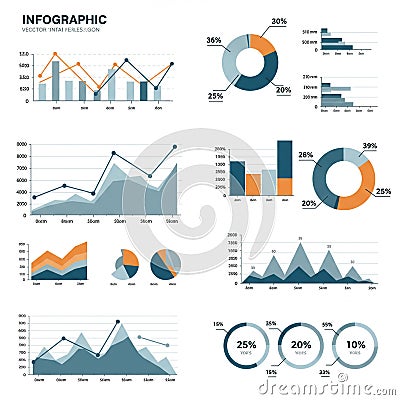
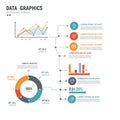
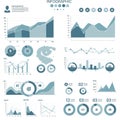
stacked sketch shades segmented screenshot presentation pie percentages pattern orange monetary measurements map logo line layout labeled information infographic indicating including illustrate gray graphs font featuring elements drawing document distribution display diagram designed design data comparative compact colorcoded clear circle charts categories cartoonInfographic Featuring Various Data Visualizations, Including Bar Graphs, Line Charts, Pie Stock Image
Designed by
Title
Infographic featuring various data visualizations, including bar graphs, line charts, pie #368501461
Description

