Find results that contain all of your keywords. Content filter is on.
Search will return best illustrations, stock vectors and clipart.
Choose orientation:
Make it so!
You have chosen to exclude "" from your results.
Choose orientation:
Explore cartoons & images using related keywords:
white
wheel
visualization
visual
vehicle
textual
text
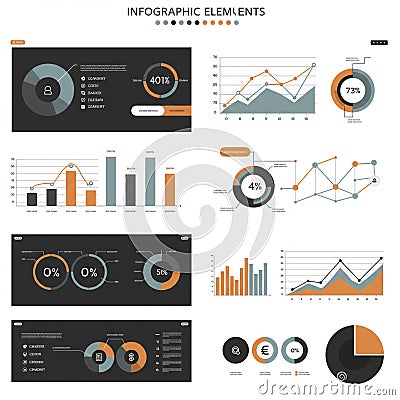
sets screenshot represents prominently presentation pie percentage palette organization orange multimedia monochromatic markers logo line legend labels interpretation infographic indicators includes gray graphs graph font elements easy drawing document displaying display diagram designed design descriptions data connectors clarity circular circle charts cartoon carInfographic Displaying Various Data Visualization Elements On A White Background. Stock Photography
Designed by
Title
Infographic displaying various data visualization elements on a white background. #377729288
Description

