Search
(+)
cartoon
dealer
buy stock illustrations
Home
My rookie portfolio
📷 Upload yours 🤳
Find results that contain
all
of your keywords. Content filter is
on
. Search will return
stock photos and royalty free images
.
Exclude
Make it so!
You have chosen to exclude "
" from your results.
Choose orientation:
Explore cartoons & images using related keywords:
2005
2006
2007
2008
2009
accounting
arrow
bar
bars
blue
chart
colorful
corporate
diagram
dollar
factor
figures
finance
financial
gain
goal
graph
grow
growth
market
measure
money
office
orange
profile
profit
progress
reflection
rise
share
statistic
stock
stocks
succeed
success
years
Business Graph 2004 - 2009 Stock Image
Download
Designed by
Pablo631
Title
Business Graph 2004 - 2009 #4161901
Description
Business Graph with arrow showing profits and gains from the year 2004 to 2009
Infographic Elements Collection - Business Vector Illustration in flat design style
Business strategy icon set, vector eps10
Abstract label business timeline Infographics elements, presentation template flat design vector illustration for web design
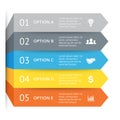
Vector arrows infographic, diagram chart, graph presentation. Business concept with 5 options, parts, steps, processes.
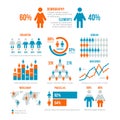
Business statistics graph, demographics population chart, people modern infographic vector elements
Infographic template with 4 options.
Infographic design elements for your business data with 10 options, parts, steps, timelines or processes. connection lines concept
Vector triangle element for infographic. Business concept with 3 options
Finance chart. Stock graph market. Growth business blue vector background. Bond data online bank
10 step process modern infographic diagram. Graph template of circles and waves. Business concept of 10 steps or options
Business infographic arrow template with 5 options. Can be used for diagram, graph, chart, report, web design.
Infographics design vector and business icons with 10 options.
Infographics design vector and business icons with 7 options.
Arrow process steps chart. Business startup step arrows, work flow graph and success stages vector infographic concept