Search
(+)
cartoon
dealer
buy stock illustrations
Home
My rookie portfolio
📷 Upload yours 🤳
Find results that contain
all
of your keywords. Content filter is
on
. Search will return
best illustrations, stock vectors and clipart
.
Exclude
Make it so!
You have chosen to exclude "
" from your results.
Choose orientation:
Explore cartoons & images using related keywords:
arrow
bar
blackboard
business
chart
charts
circle
circular
collection
color
computer
concept
data
design
diagram
diagrams
different
display
economics
education
element
elements
flat
flow
flowchart
graph
graphic
graphs
growth
icon
infochart
infograph
infographic
infographics
layout
line
monitor
option
percent
pie
presentation
print
process
report
result
sequence
set
sign
statistics
stats
Graphs And Diagrams Cartoon Vector
Download
Designed by
PixMarket
Title
Graphs and Diagrams #52201521
Description
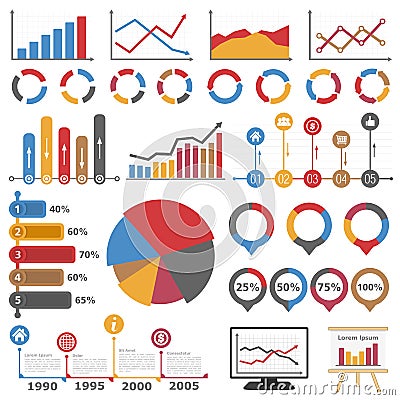
Business infographic elements collection, set of different graphs, charts and diagrams
Set of elements for infographics, charts, graphs, diagrams. In gray color. Vector illustrations
Set of elements for infographics, charts, graphs, diagrams. In gray color illustrations
Business graphs diagrams icons set.
Set of circular charts, graphs, diagrams 3,4,5,6 steps
Business analysis on smartphone with data making with bar graphs, diagrams and data transmission
Infographic graphs. Diagrams, pie charts progress bars for business presentation, data comparison and budget report
3D graphs, diagrams, charts, world map
Isometric infographic elements, colorful 3D pie charts, bar graphs, diagrams isolated. Business
data driven decision making template design charts graphs diagrams, technology sales marketing strategy
Close-up view of financial charts on computer screen. Colorful graphs, diagrams display stock performance, market trends. Data
Close-up of man reviewing graphs, diagrams with pen near laptop. Financial analyst examines business reports, performance
Visualization of physics research, including graphs, diagrams
Magnifying glass over documents with analytics data, selective focus. Charts, graphs, diagrams for financial analysis. Investment
Laptop on wood desk with city skyline reflected in screen. Stock trading graphs, diagrams. Modern tech for business, workspace,