Find results that contain all of your keywords. Content filter is on.
Search will return best illustrations, stock vectors and clipart.
Choose orientation:
Make it so!
You have chosen to exclude "" from your results.
Choose orientation:
Explore cartoons & images using related keywords:
visualization
visual
trends
tones
text
symbols
show
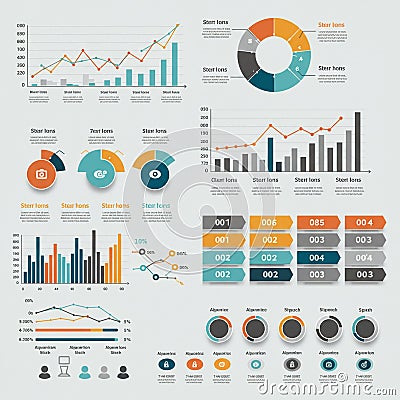
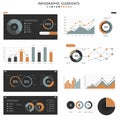
sequences screenshot scheme representing reference rectangles readability presentation pie percentages organized orange numerical number multimedia logo line labels information infographic indicate includes included icons gray graphs gadget font eye enhancing elements effectively drawing document displaying diagram design data convey consistent comparative color cleanInfographic Displaying Various Data Visualization Elements: Line, Bar, And Pie Charts. Royalty-Free Stock Photo
Designed by
Title
Infographic displaying various data visualization elements: line, bar, and pie charts. #378082581
Description

